Blog
Filter by category:
What’s new with Edge?
24th Jul 2024
In case you missed it…
–
We are excited to share our spring release of Edge! This update introduces new features and improvements designed to make data fusion and exploratory data analytics easier than ever. The valuable feedback and continued support from our users has been instrumental in shaping these improvements – thank you. We can’t wait for you to discover and benefit from the latest enhancements!
Need a reminder of the capabilities of Edge? Here’s a quick demo. Read on for some of the 🚀 new features and ✨ enhancements that have been added this month.
🚀 New View types, Homepage, and Easy Sharing
Working with geospatial data? |
Found an insight, and ready to share with your team? | ||
| You can now easily switch between a core edge view type and a dedicated map view using the map icon in views. | We have added a sharing dialog to streamline the process of sharing your findings with both individual colleagues and user groups | ||
 |
Better Graph ManagementWe heard you; the navigation drawer became too easily cluttered. To enable better graph and view management edge now has a simple homepage which separates graph navigation from view navigation. |  |
✨ Speed, Scale, and Onboarding Workflows
–
The dRISK engineering team has been working hard on upgrading the client architecture so that you can visualize even more data in your views. As a reminder, you can upload all your structured and unstructured datasets to edge, as well as directly from a database.
We have made it easier to get up and running in Edge with in-app onboarding tour and an updated documentation page. Jump straight in to an example graph with one of the following get-started workflows:
Building a Risk Map of New Zealand’s Roads
|
Fusing and Comparing Heterogeneous Transport Datasets
| ||
| In this workflow, we explore how Edge can be used to automatically reveal outliers and hidden patterns from across a dataset’s many dimensions, and accelerate exploratory data analysis to ultimately build a personalised risk dashboard within minutes | Having built a risk dashboard of a collision database (workflow above) we now delve deeper by integrating additional diverse data sources into our risk mapping analysis. – | ||
 |  |
–
You can read through the full list of updates to edge over in our docs: release notes.

A Closer Look at Motion Prediction with dRISK Edge
17th Jun 2024
By Hugh Blayney
Introduction
Here at dRISK, we want to help people understand the “brains” behind AI. In this blog post, we’ll use dRISK’s Edge software to examine an Autonomous Vehicle (AV) use case, and diagnose an underlying data problem.
We have a history of working on complex challenges within the field of AVs; one such area is that of motion prediction – given the historical motion of an entity and information about the scene around it, can you predict where it’ll go next? The setup for this problem is typically to look at other entities in a scene (i.e. not your own car), and try to predict what their movement is about to look like. The idea is that this information would then be fed into a planning module, dictating the future movement of the AV.
A paper that caught our eye with an interesting approach to the problem was “Multimodal Trajectory Prediction Conditioned on Lane-Graph Traversals” (PGP). To rephrase the title somewhat, the method in this paper explores paths through a graph representation of lanes, in order to help predict future trajectories. Even better – the authors provide a great open source implementation of their model for us to play around with. We’ll use this as a test model to see what we can learn from it …
How do you know what the predictor is doing?
A natural first question would be: how good is this model? There are some common metrics used in the literature, and PGP performs very well on them, achieving SoTA on NuScenes when it was released. But what is the model bad at? Where does it fail? How can we make it better? We could get an intuition for the model’s performance by visualizing some outputs where it doesn’t perform so well. But it would be even better if we could see these outputs in the same way that the model “sees” them – if we could organize them in some way according to the internal “world view” of the model. We will achieve this by looking at all of the scenarios at once – laid out according to the embedding that they are assigned by the model.
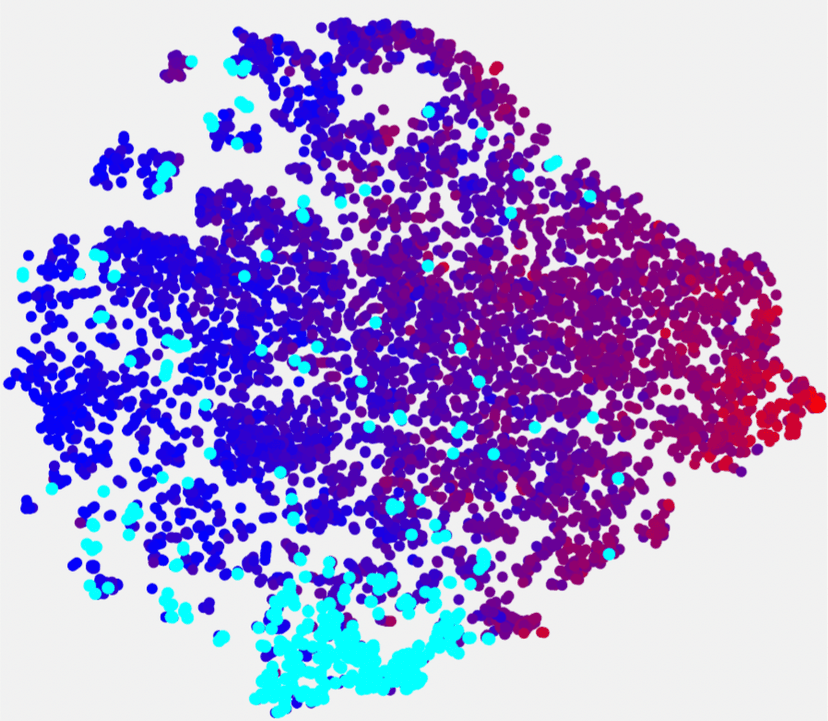
We can visualize this in dRISK Edge, a web app that allows you to quickly find complex patterns in arbitrarily structured data. Visualizing these high-dimensional embeddings in two dimensions using t-SNE gives us the following view:

Each of these points represents a “test scenario”, and they are arranged according to the model’s representation of them just before the trajectory prediction begins – so we’re visualizing how the model has represented the first 2 seconds of each scenario.
To actually look at each scenario in detail and allow us to build our intuition, we use the dRISK Scenario Gym – an extremely lightweight simulator for quickly exploring driving scenarios. For each test scenario we render a video like the one shown below; the ground truth trajectory of the vehicle in question is the red box, and the 10 predicted trajectories are shown as the lighter red boxes – their degree of opacity corresponds to their probability as output by the model.

Armed now with the power of visualization – and also dRISK’s taxonomy of automatic scenario annotations connected using Edge – let’s first see if we can get an idea of what this embedding represents. If we color by the ego maximum speed annotation (red is greater), we see that it corresponds closely to the x-axis:

And if we highlight our binary metrics corresponding to left turns / right turns / going straight, we see that these closely match the y axis:

The existence of this broad structure can be explained since the t-SNE embedding uses PCA initialisation, so the two largest principal components in the PGP embedding correspond to speed and turning – in a sense, this means that these concepts are the most important in the model’s embedding, which intuitively sounds about right. But t-SNE also does a good job of local structure; clustering scenarios together that are nearby in the PGP embedding space. This is very useful if we want to try and spot patterns – or clusters – of failures in our scenarios that aren’t captured by the largest principal components.
Let’s now look at where PGP doesn’t perform so well. We’ll start this investigation by coloring the scenarios by the NuScenes minimum Average Displacement Error (the average deviation of the predicted trajectory from the ground truth trajectory) over the top 10 predictions (minADE 10) metric (strictly – we’ll color by the log, to avoid outliers squashing the interesting color spectrum). Our embedding now looks like this:

Where “more red” corresponds to “greater MinADE 10” – or, at a high level, “worse performance”. Immediately, we see some clusters of poor performance – let’s put the human in the loop (that’s us!) and start to develop some intuition using the dRISK scenario gym renders:

There are some outliers here – scenarios where the underlying “ground truth” trajectory is unusual and the model understandably performs poorly. But the majority of poor performance is on what looks like a single intersection. We can view spatial / geographical data in dRISK Edge as well; we now explore the same embedding in the context of the scenarios’ real-world locations:

Looking at the earlier Scenario Gym renders, we can immediately see the pattern in these high-error scenarios: the underlying lane graph is incorrect, it appears to be missing a right-turning lane. Since the PGP architecture is dependent on traversals over the underlying lane graph, it makes sense that this error causes the predictions to stray significantly from the true trajectories – this particular data failure hits this model architecture particularly hard.
Conclusion
Here we used Edge to quickly investigate the performance of an AV motion prediction model, but we’ve seen Edge successfully used it for a whole host of use cases involving complicated, heterogeneous and unstructured data. If you want to check it out, you can find a free demo version here – give it a go, load in whatever data you’re interested in, and if you want to get in touch we’d love to hear from you!
Adding color and texture to Machine Learning development using Edge
22nd Apr 2024
By Federico Arenas Lopez
How the painting looks now: Introduction
As Machine Learning (ML) models become a core part of our daily workflows, the need for developers to have fine control of their behavior has never been greater. Perhaps the most evident example is during Autonomous Vehicle (AV) development, where the stakes are so high, that the better we can train the behavior of self-driving vehicles, the more lives will be safe when they are deployed.
dRISK Edge is the only tool out there that lets ML developers manipulate their models end-to-end graphically and intuitively. Edge integrates easily with ML development workflows by letting users load their datasets, understand their distribution in multiple dimensions, and ultimately control their model’s performance with unprecedented granularity. In this short blog we will illustrate this capability by training and evaluating an object detection DEtection TRansformer (DETR) architecture in an AV Perception development workflow, using a subsample of the nuImages Dataset. We will use Edge to look at DETR’s performance under a completely new lens which will let us surface failure modes that otherwise could remain hidden.
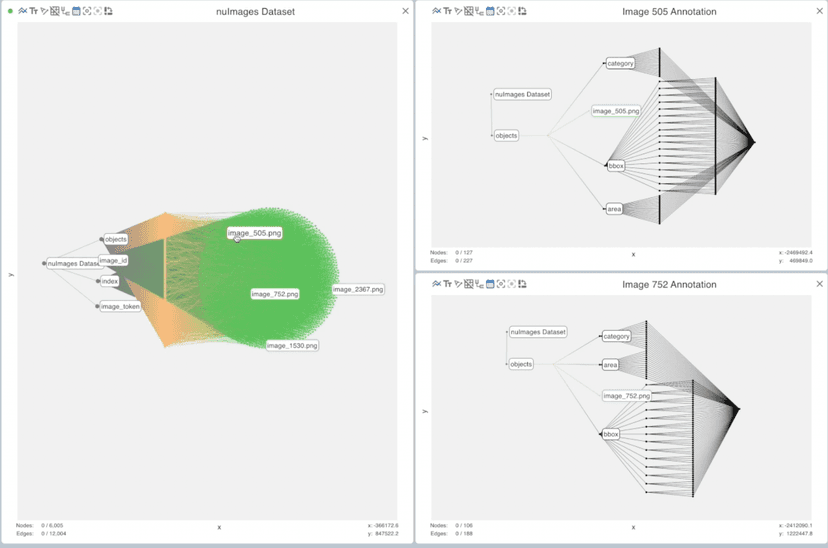
For starters, Edge’s uniqueness lies in how intuitively you can load a complete dataset and understand its broad strokes while being able to dive into the finer details of its composition. In our object detection case, this means looking at the entire dataset, while being able to inspect the different images and annotation structure.
3000 samples from the nuImages dataset loaded into Edge (left) and 4 different frames and their annotations (right).
Adding more color and texture means better grasp of your data
While Edge’s graphical interface lets you appreciate all the detail of your data at once, this alone is not enough; to truly understand their data, developers need to add more color and texture to contemplate their data in a crisp, comprehensive way. In the AV perception case, the annotation data holds a large well of potential that can be used to look at an object detection dataset under completely new tones.
To achieve this, Edge let’s developers easily add new, latent dimensions that are already hidden in the dataset. For instance, using the bounding box information we can add features that let us see (1) the distribution of how close vehicles are in each frame, (2) how crowded they are, and (3) how many of these are in the frame. These three different features –what we will call “closeness”, “crowdedness”, and “number of vehicles”– already account for a vast repository of phenomenology that lets us grasp the nuImages dataset with more understanding and control. We can look at this phenomenology in detail by looking at their distributions in Edge, as we do below.
New “closeness”, “crowdedness”, and “number of vehicles” features added to the entire dataset (left) and their different histogram distributions (right).
Expressive paintings to understand, and communicate, your model’s performance
While looking at the three distributions is helpful, this is not very compact. Edge’s ability to make embeddings from multiple dimensions lets users look at all of their features in one single, compact representation. After training our DETR ResNet-50 model for 100 epochs on a randomly sampled split of our dataset, we can use both the t-SNE and PCA embeddings to look at the distribution of performance along the features we created. This workflow empowers ML developers with a concise and interpretable method for inspecting, and communicating, their model’s performance under diverse phenomena.
Concretely, we can color our embeddings by the mAP (mean Average Precision) calculated over a randomly sampled validation set. By adding the performance measure as a 3rd dimension in color, Edge has enabled us to surface regions where our network is underperforming. Some of these regions are surfacing failure modes such as “poor performance for detecting far away vehicles”, or “poor performance at detecting frames with high vehicle numerosity”.
Performance metrics loaded into the dataset (left), and side-by-side embeddings of the entire dataset and the validation split colored by performance. Red means poor performance and blue means good performance.
By looking at the embedding in more detail, we can quickly locate frames where high risk vehicles are not being detected, or frames where vehicles are not being detected simply because they are behind a fence. This level of granularity is key for developing safe AVs, and is an inherent characteristic of Edge.
Zoom in to specific failure modes found by inspecting the validation embedding. Red means poor performance and blue means good performance.
Users of Edge can benefit from a compact and transparent way of identifying and communicating shortfallings of their models, in order to address them systematically by e.g. drawing more data from the regions of poor performance, or by tuning their models to increase overall detection performance.
Going further: Contrasting colors from different models
Another workflow Edge facilitates is the ability to compare, and communicate, the performance of multiple ML models at once. Our platform prides itself on the ability to concisely express the shortfallings and strengths of one model compared to another one, in the context of the features developers care the most about. In practice, we trained DETR ResNet-101 and compared its performance to the above results from DETR ResNet-50. We can color our embeddings by the difference in mAP, just as shown below.
(left) Performance delta distribution over the validation set and (right) t-SNE and PCA embeddings colored by the delta in performance between both models
Looking at the results under the new contrasted colors quickly allows us to see that the detection performance stayed the same or improved for around 80% of the samples in the dataset. Moreover, we can hone in on the specific failure modes and realize that most of them were mitigated by going from a ResNet-50 architecture to a ResNet-101 architecture!
The painting after adding more color: Conclusion
In this blogpost we covered how, in a very compact way, we can interface with Edge to train and evaluate DETR for an object detection application. We showed how Edge can enhance ML developers’ workflows by increasing their level of control over a network’s performance, in an interpretable manner.
By using Edge, ML developers, just like painters, can exploit the latent color that is in their data to ultimately understand and improve their model’s overall interpretability and performance. This is applicable to any retraining workflow, be it in Computer Vision or Natural Language Processing. If you’re an AI developer and you’d like to try out Edge, you can do so at demo.drisk.ai.
Using Edge to navigate LiDAR Data: from the surface to the bottom in minutes
7th Mar 2024
By Federico Arenas Lopez and Katarina Cimesa
Assessing the surface: Introduction
LiDAR-based perception plays an increasingly important role in deploying safe Autonomous Vehicles and ADAS systems. In this short blog, we will illustrate how dRISK Edge can help LiDAR developers analyze the performance of their sensors under challenging circumstances, all in a matter of minutes, with little pre-processing or setup, all in the cloud.
Edge is the only tool out there that allows users to navigate, and grasp all of their data at once without losing granularity. In this blogpost we show (1) how Edge’s unique way of showing you all of your data at once enables LiDAR developers to easily find unknown, possibly hazardous objects in their data, and (2) how Edge’s crisp interactivity enables LiDAR developers to dive deep into individual data coming from different sensors.
Edge’s highly scalable data visualization and interactive exploration capabilities are particularly useful for finding patterns in point cloud data. dRISK supports many different data formats, including the ones found in the Cirrus Dataset, which we’ll use for demonstration purposes. Below you can see the 3 different files for a single frame loaded into the same session in Edge.
Cirrus Dataset point cloud loaded into Edge for a single frame
Navigating the surface: Finding unknown objects in a sea of LiDAR data
To assess the performance of their perception system, developers can use Edge to find frames with traffic situations that are particularly challenging for LiDAR. For example, unidentified objects on busy highways form a specific cluster of risk. Edge lets you load the complete dataset annotations at once and makes it easy to find, and visualize, those objects annotated with the label “unknown”.
Complete Cirrus dataset 1 loaded into a single view on the left, and a single JSON annotation on the right
Edge lets users leverage the graph structure, and lets users have all the data in one place, making it trivial to surface outliers such as a chair, presumably fallen off a vehicle shortly before, is lying in the middle of the highway.
Edge lets users grasp large datasets without losing touch of the individual data points. By using Edge, we can inspect each datapoint from the frame above and see what the underlying object type is. We see that all of them are vehicles apart from one object that is annotated as “unknown”. The data points can be colored by the LiDAR intensity, and we can see that the “unknown” chair stands out.
Identifying the unidentified object as a chair enriched by the JSON annotation, the LiDAR point cloud, and the camera feed
Edge allows for comprehensive exploration of any kind of data. In this case, by exploring for “unknown” entities in the Cirrus Dataset, developers can quickly understand the limitations of the dataset for training and validation purposes, and come up with strategies to counter these limitations.
Diving to the seabed: Assessing Performance of LiDAR settings
Edge lets users go from coarse analysis to granular analysis of a dataset in a matter of minutes. For example, understanding and comparing the long range detection performance of scan patterns in great granularity. Using the same frame as an example, we can see how the number of hits for the vehicles in this highway scene drops by about 5x after 120m for the Gaussian scan pattern setting.
Using Edge’s cross highlighting functionality to characterize the Gaussian scan pattern in multiple dimensions
Moreover, by overlaying the two point clouds taken from the two sensors used in the Cirrus Dataset, we can easily characterize the strengths and weaknesses of each of the scan patterns, Uniform and Gaussian. In the example below, notice how the dark blue distribution consistently shows a higher number of hits for distances higher than a couple of meters (along X [m]), showing that the Gaussian scan pattern outperforms the Uniform scan pattern for long distance sensing. However, when looking at the top left and bottom right plot, the Uniform scan pattern is able to fill the blindspots in wider fields of vision.
Overlay of point clouds from the Uniform (dark blue dots) and Gaussian (light green dots) scan patterns, “# of hits” is the number of LiDAR data points hitting a specific point along the given axis
With just a few clicks, Edge enables ADAS developers to find the optimal LiDAR setting for their downstream application by iterating over many different sensor configurations.
Coming back to the surface: Conclusion
We covered how, in a matter of minutes, users can go from coarse analysis of their data, to in depth analysis, finding unknown entities in the dataset, to comparing LiDAR sensor scan patterns, using the Cirrus Dataset as an example. These are workflows that are trivially extendable to other use cases where there’s a need to have a complete understanding of large datasets, without losing granularity. If you are interested in understanding large datasets in a complete way, in as long as it took you to read this article, try dRISK Edge for yourself now at demo.drisk.ai.
Legal notice
- Luminar Technologies, Inc. is the sole and exclusive owner of the Cirrus dataset.
- The dataset is licensed under CC BY-SA 4.0
- Any public use, distribution, display of this data set must contain this notice in its entirety.

Everything your parents didn’t tell you about AV and ADAS needs, from Level 2 to Level 5.
19th Sep 2023
By Kiran Jesudasan
Autonomous Vehicles are inherently complex, and their data requirements are multifaceted. For the purpose of this blog article, our focus will be on the evolving regulatory landscape of testing. We will delve into the history of regulatory testing, highlight key changes projected for the industry, and demonstrate how dRISK aligns directly with this evolution. Specifically, we will examine the testing of automated features and how it has evolved.

The European National Crash Assessment Program, commonly known as EuroNCAP, was established in 1996. It was the result of collaborative efforts between various departments of transport and safety groups across Europe, aiming to create standardized testing procedures. The idea behind a centralized testing system was to eliminate the need to pass individual country’s testing procedures, simplifying the process and facilitating market entry. Thus, EuroNCAP was established. In 2001, they awarded their first 5-star rating to the Renault Laguna.

2009. EuroNCAP began testing Electronic Stability Control (ESC) by subjecting vehicles to rigorous turns in wet weather conditions, comparing performance with and without the system activated to assess their ability to stay on track. However, after ESC became mandatory in 2014 and virtually every car was equipped with it, EuroNCAP discontinued testing this feature as it no longer provided a competitive advantage.
2014. EuroNCAP initiated their testing protocols for Automatic Emergency Braking (AEB), marking the beginning of automated safety feature testing. The initial tests for AEB were relatively straightforward, consisting of two types: one where an ego vehicle (the car under test) approached a stationary car, and another where it approached a moving car at a consistently slower speed.
2015. EuroNCAP introduced tests for Automatic Emergency Braking (AEB) performance involving pedestrians. These tests consisted of two types: the first involved an adult manikin walking perpendicular to the path of the ego vehicle, while the second test replicated the scenario with a child manikin. Notably, the latter test incorporated additional complexity by introducing two additional vehicles as occlusions. This marked the first instance of enhancing testing regimes to assess the effectiveness of specific autonomous features. It’s an important trend to observe as it showcases the evolving nature of testing methodologies.
2018. EuroNCAP started to test AEB with cyclists, again with two variations where the cyclist is moving perpendicular to the vehicle under test and another where both travel in the same direction. Start to see a trend emerging?
In the same year, EuroNCAP introduced additional tests to assess level 2 functionality. These included various scenarios for AEB, such as evaluating the ego vehicle’s response when another vehicle cuts into its path, when a vehicle in front of the ego suddenly veers out of the way to reveal a stationary car ahead, and how the ego vehicle reacts to a decelerating vehicle in front of it. Furthermore, the testing regime incorporated navigating an S curve to evaluate the performance of Automatic Lane Keeping Systems (ALKS). Lastly, the assessment also measured how well the ego vehicle avoids obstacles placed on the road.
2020. EuroNCAP further broadened its testing scope. They incorporated scenarios such as unprotected turns involving both pedestrians and vehicles, AEB with pedestrians while reversing, and assessments that focused on pedestrian safety during nighttime conditions. It becomes evident that there is a clear trend toward expanding the testing of active safety features in conditions that mimic real-world conditions.
2022. The European Commission starts applying the new General Safety Regulation (GSR 2), which makes many active safety and advanced driver assistance features mandatory for all cars sold in the EU. Similar to the evolution of EuroNCAP testing, the GSR 2 requirements start with relatively mature features, such as AEB, but also paves the way towards having fully autonomous and driverless cars in the EU.

When regulators launch a test program, it typically begins with relatively simple tests. As time passes and more data becomes available, along with pressures from the industry, consumers, and other regulatory agencies, testing mandates become more complex. In the case of ADAS and ADS testing, it started with a few scenarios involving car-to-car interactions and then expanded to include pedestrians and cyclists, and eventually objects. Initially, testing took place in clear environmental conditions, but now it is also progressing towards nighttime testing. The aim is to continuously develop tests that accurately capture the complexity of the real world and the myriad of peculiar and fascinating phenomena we encounter daily on or near our roads.
What the market needs is:
- An understanding of all of the GSR2 requirements and how they are going to expand
- Scenario data that enables manufacturers to test GSR compliance of active safety features early in the development cycles
- Tools for managing test data that adapt to more and more complex regulatory requirements
- Knowledge of how testing frameworks differ from market to market, down to the level of concrete testing procedures and pass-fail requirements
- A clear vision of how these testing requirements will evolve for level 4 and 5 systems
We developed dRISK Edge as a data management platform that enables users to visualize and explore the entirety of testing and training scenarios for ADAS and AVs. These scenarios include test cases for active safety features mandated by GSR 2, which are represented by a cluster of green nodes in the above screen recording.
Orange scenarios are not mandated by GSR2 yet but are specified based on the evolution of the EuroNCAP tests. The embedding space plotted here is a convenient method for exploring clusters of similar scenarios. The videos of simulation renderings attached to the scenario nodes allow further interrogation and show how the advanced scenarios differ in terms of complexity.
Red nodes are specified based on where EuroNCAP is expected to move towards in 2025 and 2030, i.e. capturing more real-world complexity. For example, these scenarios include a pedestrian crossing the path of the ego in a roundabout, not just a pedestrian and a roundabout in separate scenarios.
dRISK customers have access to scenario data that can be used in different simulation platforms (e.g. IPG Carmaker, NVIDIA DRIVE Sim, rFpro) for virtual testing against the current EuroNCAP and GSR 2 requirements. But the dRISK Knowledge Graph also contains many more scenarios that are not (yet) relevant to regulated or voluntary safety assessment programmes, including many edge cases. Ultimately, dRISK aims to help manufacturers build crashless cars that can handle anything the world throws at them, and EuroNCAP and GSR 2 are only the first steps toward this goal.

Edge Case of the Week: Red Lights
23rd Aug 2023
For the “Edge Case of the Week” dRISK would like to nominate a class of events that shouldn’t be edge cases at all. Red lights.
Surely, stopping at red lights should be among the first tasks any driver learns, whether human or autonomous. You’d think red lights would be trivial for AI. After all, even the simplest LEGO robots have color sensors. But the few ADAS and Level 2 autonomous systems that can stop at red lights are much less reliable than humans (just try it sometime on a Hands Free system with your foot over the brake, or see dozens of examples documented on social media). And even though Level 4 fully driverless systems have come a long way since the early days of blowing reds, it still occurs occasionally, even as recently as a month ago in San Francisco.

Moreover, as risky as it is that an autonomous vehicle might fail to stop at a red, more important is how they behave when the lights themselves or the human drivers act unpredictably. Will the AV know how to handle a power outage, when all the stoplights are off? What about unusual scenarios, such as those that can happen in the UK, where green and red lights can be lane-specific and unusually positioned, and the consequences for mixing them up could be dire.
Or what about one of the edgiest cases – when a human driver runs a red, and t-bones your vehicle at high speed? Last week a fully autonomous vehicle was hit by a red-light runner in San Francisco. It wasn’t the AV’s fault in a legal sense, and thankfully the AV had no passenger at the time. But might a human driver have done an emergency brake soon enough to avoid the crash altogether?
A conservative human driver approaching a light that just changed from red to green knows to slow in case of a red-light runner in the crossing lane. What’s more humans have exquisite motion detection, honed over millions of years of evolution and connected to fast-response pathways that brake within a half second. Can AVs demonstrate the same capabilities? Another driver running a red is responsible for less than 2.5% of all human accidents, but responsible for more than 5% of fatalities involving semi-autonomous systems. For fully driverless vehicles reliant on traditional LIDAR and teleoperation, a t-bone scenario can be particularly hard because of the very limited information about other vehicles approaching at high speed from the side and from behind occlusions.
Autonomous Vehicles could have superhuman responses if they could take better advantage of their sensorium and compute. Even better, if trained with next-generation techniques, perhaps AVs could develop something approaching a conservative driver’s common sense. As AVs become a commercial reality, let’s insist that they handle everything that can happen around a red-lights not merely as well as the average human driver, but many times better.

Whack All Your Moles at Once: Addressing Hidden Safety Flaws in Autonomous Vehicles
12th Jul 2023
By Lorenzo Niccolini and Hamish Scott
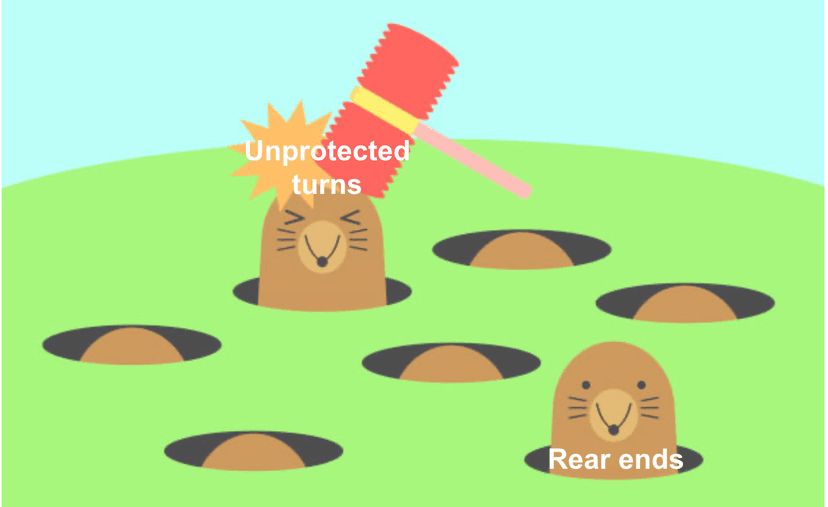
The reason we still don’t have ubiquitous AVs is that dealing with the tail-end complexities of the real world turns out to be really hard. A manifestation of this is the ‘whack-a-mole’ problem: you – an AV/ADAS developer – encounter a problem with the vehicle’s performance on a specific case, say unprotected turns. You work on a fix and ship a new update. Success. Well nearly. Unfortunately you later notice that you are getting rear-ended a lot more than you used to… So now you go and fix that issue successfully, and your AV now boldly drives in a way that more closely matches human-follower expectations, while hopefully maintaining performance on unprotected turns. But lo and behold, you now find out that you’re driving more boldly than your perceptions can handle, and you deteriorate in reacting to jaywalking pedestrians. Or what’s worse, you as the AV developer don’t even recognise the new failure modes before your users start posting them on YouTube.
The cycle continues where you address each problem, only to encounter new ones that were not anticipated. In other words, you whack one issue only to find a new one cropping up and limiting your ability to monotonically improve performance.

So the question is: how could you have anticipated this? Yes you could have written perfect code that accounts for each eventuality. But that turns out to be pretty hard. dRISK has taken a different approach: we’ve built a training, testing and validation platform that makes the above discoveries self-evident. Allowing developers to uncover and understand hidden safety flaws faster, thus avoiding endless whack-a-mole.
Training and Testing on Edge Cases
We’ll start with some groundwork. Simulation based testing, including re-sim (re-playing of logs coming from real world failures) is really the only way to reach the scale needed to ensure that your autonomous vehicle is safe and robust enough for deployment in the real world. That’s not to say that real-world testing is not important – it is. But, by leveraging simulation properly you can test on a much vaster set of scenarios for a fraction of the cost.
More importantly though is what you’re testing on. The majority of your focus needs to be on the edge cases: the individually unlikely cases that together make up all the risk space. A cyclist running a red-light, a child running onto the road behind a ball, a fallen wire in the middle of the road. The incredible variety of edge cases causes the space to become incredibly sparse and high-dimensional. Driving thousands of miles on sunny, low traffic roads counts essentially as just one scenario in the sense that there are few features associated with it. But, when we start to consider more edge cases, the feature space explodes, each scenario occupying its own unique area of risk. Of course, this space is not random – it has structure, and harnessing this structure is exactly the problem.
Different sides of the elephant
To dig a little deeper into this complexity we will make use of another animal metaphor: the parable of the ‘blind men and elephant’ which describes the story of six blind men who come across an elephant and try to understand what it is by touching it. However, they each touch a different subset of it and they all misinterpret what the animal is.
Just like with the elephant, if you have access only to a narrow view of the scenario risk space you will misinterpret a pattern for something that it is not, you will fix the wrong problem and therefore encounter a new unexpected one. This is exactly why you end up with whack-a-mole in the first place.
To avoid doing this you need a way to see the whole picture. To see the space in as much context as possible. That’s why all our data is stored in one single data-structure and accessible in each of its dimensions through dRISK Edge. Three particular dimensions we will explore in a bit more detail now are (from left to right in Figure 1):
-
- Taxonomic view: we annotate scenarios (and indeed we have automatic processes to do this) with many semantic features describing the content of each. E.g. number of entities in a scene, types of entities in a scene, intersection-type, maneuver type, intersection-type etc.
- Geospatial view: we can also look at the scenarios geographically: where in the world or along the route did the scenario take place.
- Embedding view: to get the broadest view of our data we can use combinations of all the above features to create embedding views. The upshot of this is to be able to see the scenarios in a much richer space. More on this is in a moment.

A worked example: improving AVs trained with deep reinforcement learning
To see how we can use each of these to avoid whack-a-mole lets go through another concrete example in which we trained an AV with deep reinforcement learning. One of the most intuitive ways to visualize the AV’s performance is through a geospatial view (Figure 2). By examining the performance geographically over the route, developers can start to identify patterns of behavior. However this view alone cannot reveal the complete picture as other features may be driving the performance distribution.

To gain a more comprehensive understanding we can turn to the embedding view. To create this we have first learned a deep embedding of the scenarios in the dataset based on their features. These include the types of entities, their interactions and the road geometry. To create a view of the embedding we use principal component analysis to perform a dimensional reduction. The result is a space that organizes scenarios based on their semantic similarity. Clusters in this view are more likely to represent similar patterns of behavior, enabling the identification of specific failure modes.

While the embedding view provides a holistic perspective, interpreting the clusters and identifying failure modes may not be immediately evident. This is where the rich taxonomic feature space also encoded in our knowledge graph comes into play. We can use the raw feature data of the scenarios in the clusters to produce an interpretation of the failure mode.
A few short steps of analysis can identify the features that best describe the cluster of poor performance. For example, we may find that the cluster consists mostly of scenarios with occluded pedestrians crossing the road. An interpretable description of the cluster will allow us to identify the true cause of the failure mode.

Once the failure mode is identified, we can proceed with the necessary fixes. This might mean fixing bugs in the code, retraining with a better training data distribution, or enhancing the AV’s architecture. By following this approach developers can achieve continuous improvement over the space of risk, addressing safety-critical scenarios effectively. Let’s conclude with a couple of other examples from dRISK customers.
Worked examples: dRISK customers avoiding whack-a-mole
Figure 5 shows improvements from edge case testing, in a paper we published together with Hitachi Astemo’s motion planner.

Similarly to the embedding views above these views show the performance of the planner in a scenario space organized by similarity. The three main things to take away from the figure above are the following:
-
-
- Each node (dot) represents an edge case scenario on which Hitachi’s motion planner was tested.
- The edge cases (nodes) are positioned in the space such that scenarios close to each other are similar while those far apart are more different.
- The larger nodes represent collisions produced by the planner.
-
A five-fold improvement in collision rate was achieved after being exposed to edge cases which can be seen by comparing the left and right images.
A second example can be seen in Figure 6, which shows an (anonymised) progression view from a dRISK customer where a set of key indicators are tracked over time. This highlights a different advantage of this approach: having constant visibility of our performance on the entire risk space. This is invaluable to avoiding hidden failure modes while developing an AV. We can monitor these views to understand how performance changes with every update. By combining multiple views into the space of risk as well as the analysis of many taxonomic features, developers can gain comprehensive insights into AV performance. This empowers them to identify failure modes accurately and apply targeted fixes, resulting in safer and more reliable autonomous vehicles.

The Self-driving Crucible
27th Feb 2023
Chess Stetson has published his thoughts on the current state of the Autonomous vehicle industry which seems like it is at a low point in the hype cycle just now. However, it is not all bad news as Chess and the dRISK team believe that if the autonomy goals changed from incremental improvements on normal driving, to demonstrating completely bombproof collision avoidance, we’d see autonomous technologies pay off sooner and spread faster. Instead of waiting for third parties to demonstrate risks of already-deployed systems and then NHTSA to issue recalls, AV developers, OEMs and Tier 1s should demonstrate comprehensive safety before new technologies are released. The consumer, as well as the transport authority, should expect AV developers to show extraordinary performance on avoiding hundreds of thousands of fatal collisions within highly sensor-realistic simulations with all the possible agents fully represented, followed up by hundreds of track tests. With this change in development philosophy, dRISK believes there’s a crash-free AV right around the corner.
Read the article via Medium here.

Developing autonomous vehicles requires planning for the unexpected …
27th Jun 2022
…including changes to the Highway Code. Kiran Jesudasan, Transportation Systems Specialist at dRISK, explains why developers need to change their assumptions if AVs are ever to be commercially deployed at scale.
On 29th January 2022, changes were introduced to the Highway Code following public consultation. In essence, a new hierarchy of road users has been introduced, putting those most at risk of a collision at the top. The changes have been implemented after consultation with businesses, organisations and the public.
The notion of putting the most vulnerable at the top of the hierarchy is important for road safety and while there has been some controversy over the new rules, they come at a time when cities in the UK are re-evaluating urban living and how smart city concepts can be applied.
As a researcher in autonomous vehicle safety, I believe there is a fundamental line of enquiry that must be introduced to research. Until now, concepts for safety have been based on what we know to be true at the time, often from lived experience.
The rules of the road have now changed, and it’s vital we understand how human behaviour will change as a result of the law – if at all – and how the development and deployment of self-driving vehicles should be adapted. It’s an important aspect of AV development, and just like the Highway Code has safety at its heart.
Developing safe AVs is complex, and regulators are in a catch 22 state – they need commercial deployments to prove safety, yet they can’t risk safety with a commercial deployment that’s unfit for the roads. What’s needed is a robust set of standards and regulation that accounts for all safety aspects and yet are flexible enough to incorporate the evolving landscape of what is considered truly safe and safe enough. The Highway Code is also a good example of how AVs are only as good as the information they learn from. Up to now, AVs may have been trained on data of road behaviour only before January 29th.
Now they must adapt to new rules and new human behaviours. And in order for the AVs to learn how to behave with these changes their developers need to re train them to do so.
So how can they do this? Let’s step back and look at what has changed.
Firstly, a new hierarchy of road users has been established, where vehicles that can cause the greatest harm in the event of a collision bear the most responsibility to reduce the risk to other road users. This applies to trucks of varying scale, cars, vans and motorcyclists but also considers cyclists and horse riders as road participants who need to minimise risk to pedestrians.

Secondly, pedestrians have been granted increased priority at junctions. All road users need to give way to pedestrians waiting to cross a road or already crossing it. This takes effect on zebra crossings and also for pedestrians and cyclists waiting to cross at a parallel crossing.
Finally, cyclists, horse drawn vehicles or horse riders should not be cut off when turning into or out of a junction, or while changing lane. This applies whether they are using a cycle lane or just riding on the road, and road users should not turn at a junction if doing so causes a cyclist, horse drawn vehicle or horse rider to swerve or stop. Simply put, the changes aim to increase awareness of vulnerable road users and do a lot more to ensure they are safe.
One of the great promises of autonomous vehicles is that they can in theory reduce all human error on the roads. No one company can wholeheartedly say that it is a milestone that they have achieved but over the last few years, through the use of advanced sensors, and in many cases simultaneous 360 vision, the AV industry is exploring exactly how to achieve that elusive goal. In the meantime, however it is the job of regulators and safety authorities to ensure that the AVs on the road do adhere to the rules of the road, including these new changes.
How do they do that? Obviously, it comes down to testing and the new Highway Code changes mean more, and different testing is required. It’s not a change developers will have necessarily accounted for in their plans to launch a commercial vehicle.
Regulators and developers will therefore need a way to look at how changes to laws influence safety assumptions. Take the varieties of junctions in use and the myriad of ways vehicles, pedestrians, cyclists, horse drawn vehicles and horse riders can and do behave at those junctions today.
How will that change in the future? It’s unlikely to be an overnight change, people need to adjust to the law. So, development needs to allow for an understanding that some people will abide by the new rules and others won’t.
One acceptable way to approach the problem is to look at past accidents to inform testing. For example, accurate reconstructions can be built and used to test an AV’s performance in specific and true to life scenarios.
But regulators will still need a way to determine which tests are the most relevant and representative of inherent risks at intersections under the new laws. This is particularly difficult because everyone is adopting the law at different rates. Plus, at one end of the scale there will be notorious junctions that offer a plethora of accidents to simulate, and at the other, more ‘freak’ one in a million chance accidents that an AV could legitimately be confronted with, but no one could imagine.
It presents a challenge – how can developers minimise the number of tests that can be done on an AV stack while covering as many scenarios of what could go wrong? Simulation can be used here to identify areas where the AV is failing considerably quicker than conducting real world tests. However, this line of thinking also helps to introduce a framework to testing too, one where any class of simulated scenarios that an AV fails can be explored more deeply through real world tests.
What can the changes to Highway Code teach us?
Bottom line is that road traffic and design isn’t linear, so it’s easy to imagine that AVs will have to be re-certified against specific tests, determined by a robust data analytics phase that is agile enough to be able to cope with things like Highway Code changes.
It also highlights the risk of bias in the continuous development and learning of AV vehicles. An unprotected right-hand turn with oncoming traffic where several pedestrians are both near and on the opposite pavement, some walking and some just waiting, will be considered high risk. But over training an AV to cope with this scenario to the detriment of a left-hand turn could ultimately yield a less safe AV.
In the same way, AVs need to make fast and correct assessments of risk to a waiting pedestrian when there is a gap in the oncoming traffic. Scenarios need to consider, cyclists as well as motorbikes and vans, different times of day, seasons and weather, and the surprise of a runaway dog.
It’s easy to see then that this one scenario of a left-hand turn can become, in truth, infinite. That is why it is essential to know what type of risky behaviour is inherently present to ensure the types of scenarios used for testing AVs are relevant. The law changes can then be overlaid to these working assumptions.
That’s a critical point. Can someone in a lab set the relevant scenarios? Can they put aside bias of how women use the roads compared to men, or how skin colour needs to be accounted for? And can they build algorithms that can adapt to changes in road laws?
From an AV developer’s perspective, when new highway rules are introduced, the AV stack behaviour needs to be updated to compensate and allow for these new rules. AV developers might look through all the data they have collected and find scenarios that are close or ideally identical to the ones in question, like a cyclist approaching from behind on the left that wants to continue straight while the AV wants to turn left.
They would create several iterations of this to try and see how their AV handles variations. The danger here is that you are limited by what you have seen on deployments. You may well miss fundamentally strange and rare scenarios that are very hard to capture on standard AV deployments.
In a situation such as new rule changes, the chances of missing key scenarios by training in this way are even greater. AV developers will need to expand their scenario pools to include those they have not yet come across but are still grounded in reality.
That’s why it’s critical the AV community works together to establish the practice of leveraging edge cases to ultimately inform safety and architecture of an AV design. Also it will be critical that flexibility be incorporated into the verification process so that when changes like the ones to highway code do happen, they can be handled, and performance verified with elegance. We can no longer only operate on perceived wisdom alone, there are too many accidents to prove AVs have further to go in terms of safety.
Instead, we must find the one in a million chance encounters that have genuinely happened and use them to train AVs to deal with them, creating a bedrock that can be adapted when new rules come in. Until this happens, regulators will be operating with one hand tied behind their backs and AVs will never be deployed on a scale that can transform how we commute and plan urban spaces.

Can an Autonomous Vehicle handle a storm?
1st Apr 2022
Storms often provide a test for British infrastructure and the early months of 2022 saw Storm Eunice, swiftly followed by Franklin, give the sternest of examinations.
Sadly the UK transport infrastructure weakness in such an environment was exposed with more pressure being put on the UK roads as commuters would turn to cars to get by. Airports saw diverted and cancelled flights with the UK rail infrastructure running skeleton services as fallen trees scattered the tracks.
Driving into London from my home in Wiltshire was a challenging experience during Storm Franklin. Debris from trees scattered the roads with floods in areas creating diversions to make the journey longer.
Humans are able to assess their path and then consider the challenges on the road to make a rational decision on the course of action ahead as I did on this journey. A question that occurs to me is how an Autonomous Vehicle might act in such an environment.
People have subjective factors that keep us and others safe, one of them being self preservation. A slightly flooded country road will mean I can judge if water is shallow enough for me to drive through. An AV Car would have the same dilemma but how would it act?
Would the AV Car calculate the risk and judge the deepness of the flooded part of the road and thus give due safety to passengers and those around the vehicle? What is an easy situation for ourselves is possibly not the same for an AV. The ease we have in terms of judging how deep a flooded road is, might be too complex for an AV.
Another scenario that a storm could bring is obstacles from buildings falling into the road. In such a case we as humans would never try to just drive through such an obstacle, would an AV?
Driving on the M25 large lorries would be driving at 30 mph in an effort to avoid being blown around and in some cases over by the blowing storm. Potential dangers for the small vehicles driving at a normal speed on the motorway. Another scenario for an AV Car. A scenario that developers and makers of AV cars would have to consider.
Engineers of Autonomous Vehicles will be looking at different scenarios all the time, hundreds of different scenarios. Getting the correct eventuality of these scenarios correct is the big challenge. Climate change will bring predictably unpredictable weather to the UK roads over the next few years, predicting and calculating these scenarios is one of the many challenges for AVs.
∂RISK works every day to prepare AVs for the scenarios and complex situations on the road. We focus on edge-cases, the one in a million high risk scenarios and situations that AVs should be prepared for.
A person at a traffic light in a green coat about to cross the road on a red light and the pedestrian walk sign is an easy spot for a human but an AV might see the green coat as GO. This is an example of a high risk situation and what is meant by an edge case.
∂RISK uses real-life data from road and traffic cameras, accident reports Insurance claims, and peoples experiences. We constantly gather information to create the world’s largest library of edge case scenarios.
∂RISK then takes the world of data to create simulations for training AVs for each and every scenario. Information and training from our Edge Cases allows AVs to see these hazards and scenarios before they even occur.
For AVs to not just be regulated properly but to have confidence with the general public, the must be tested for all possible scenarios and situations for the road.
The testing capabilities that we have developed at ∂RISK means AVs are already being tested and trained on edge cases of extremely rare events that can happen. Testing, training and validating on ∂RISK edge cases will mean that AVs will be safe in storms and all the fallout they may bring.

- © 2026, Copyright dRISK
- Privacy Policy
- HTML Sitemap
- Sitemap